

Draw a diagram
Draw a system, a workflow, a deployment or a data model on the canvas, join its parts with arrows, and submit it to be graded on what it joins.
Updated
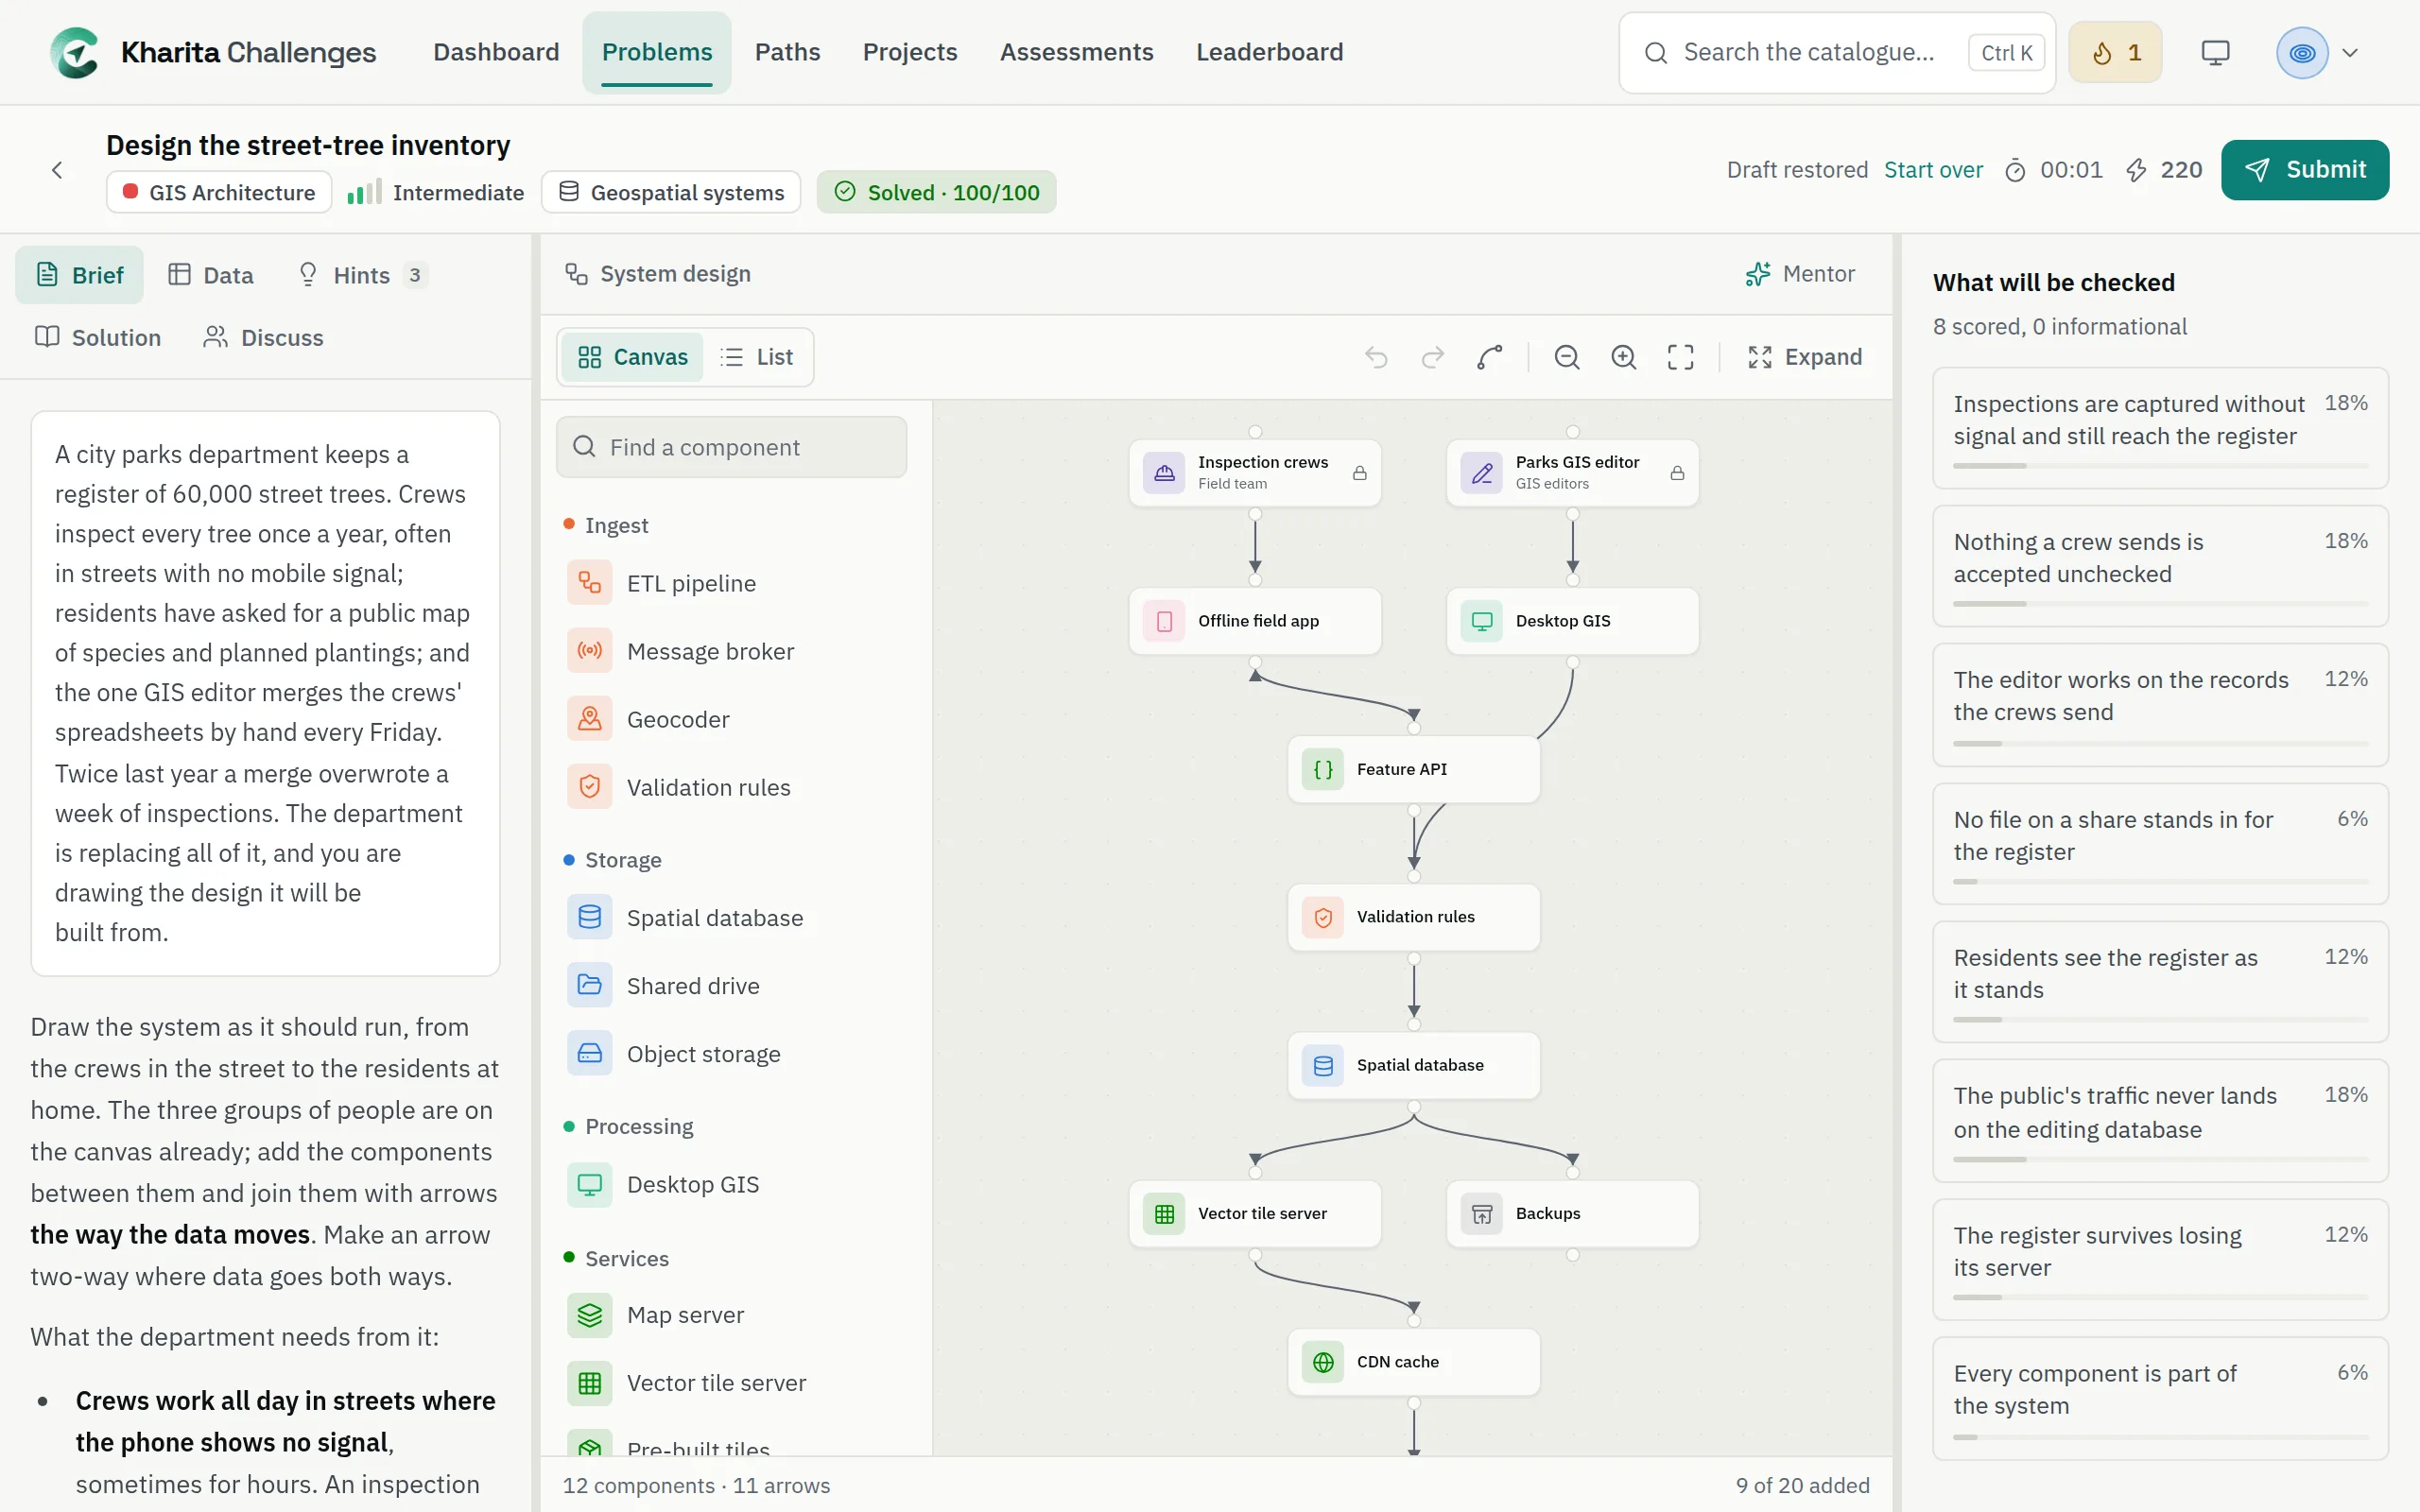
Some problems are answered by drawing: the components of a GIS system an organisation should run, the steps of an analysis as a model builder lays them out, the machines an enterprise deployment runs on across availability zones, or a geodatabase's classes as UML. The brief describes what the design has to do; the diagram is your answer.
Draw on the canvas
Step 1: The parts the brief fixes — the people, the sources, the input layers, the classes a data model names — are on the canvas already, marked with a lock. They cannot be removed.
Step 2: Add a part from the list on the left: click it to put it in the middle of the view, or drag it where it belongs. Find a component (or step, or class) narrows the list and says what the part is for.
Step 3: Draw an arrow by dragging from any side of a part — a dot shows on each side as you point at it — and letting go anywhere on the part it goes to. Let go over empty canvas and the canvas offers the part to add there, joined by the arrow. Arrows follow the data: from where it comes from to where it is used.
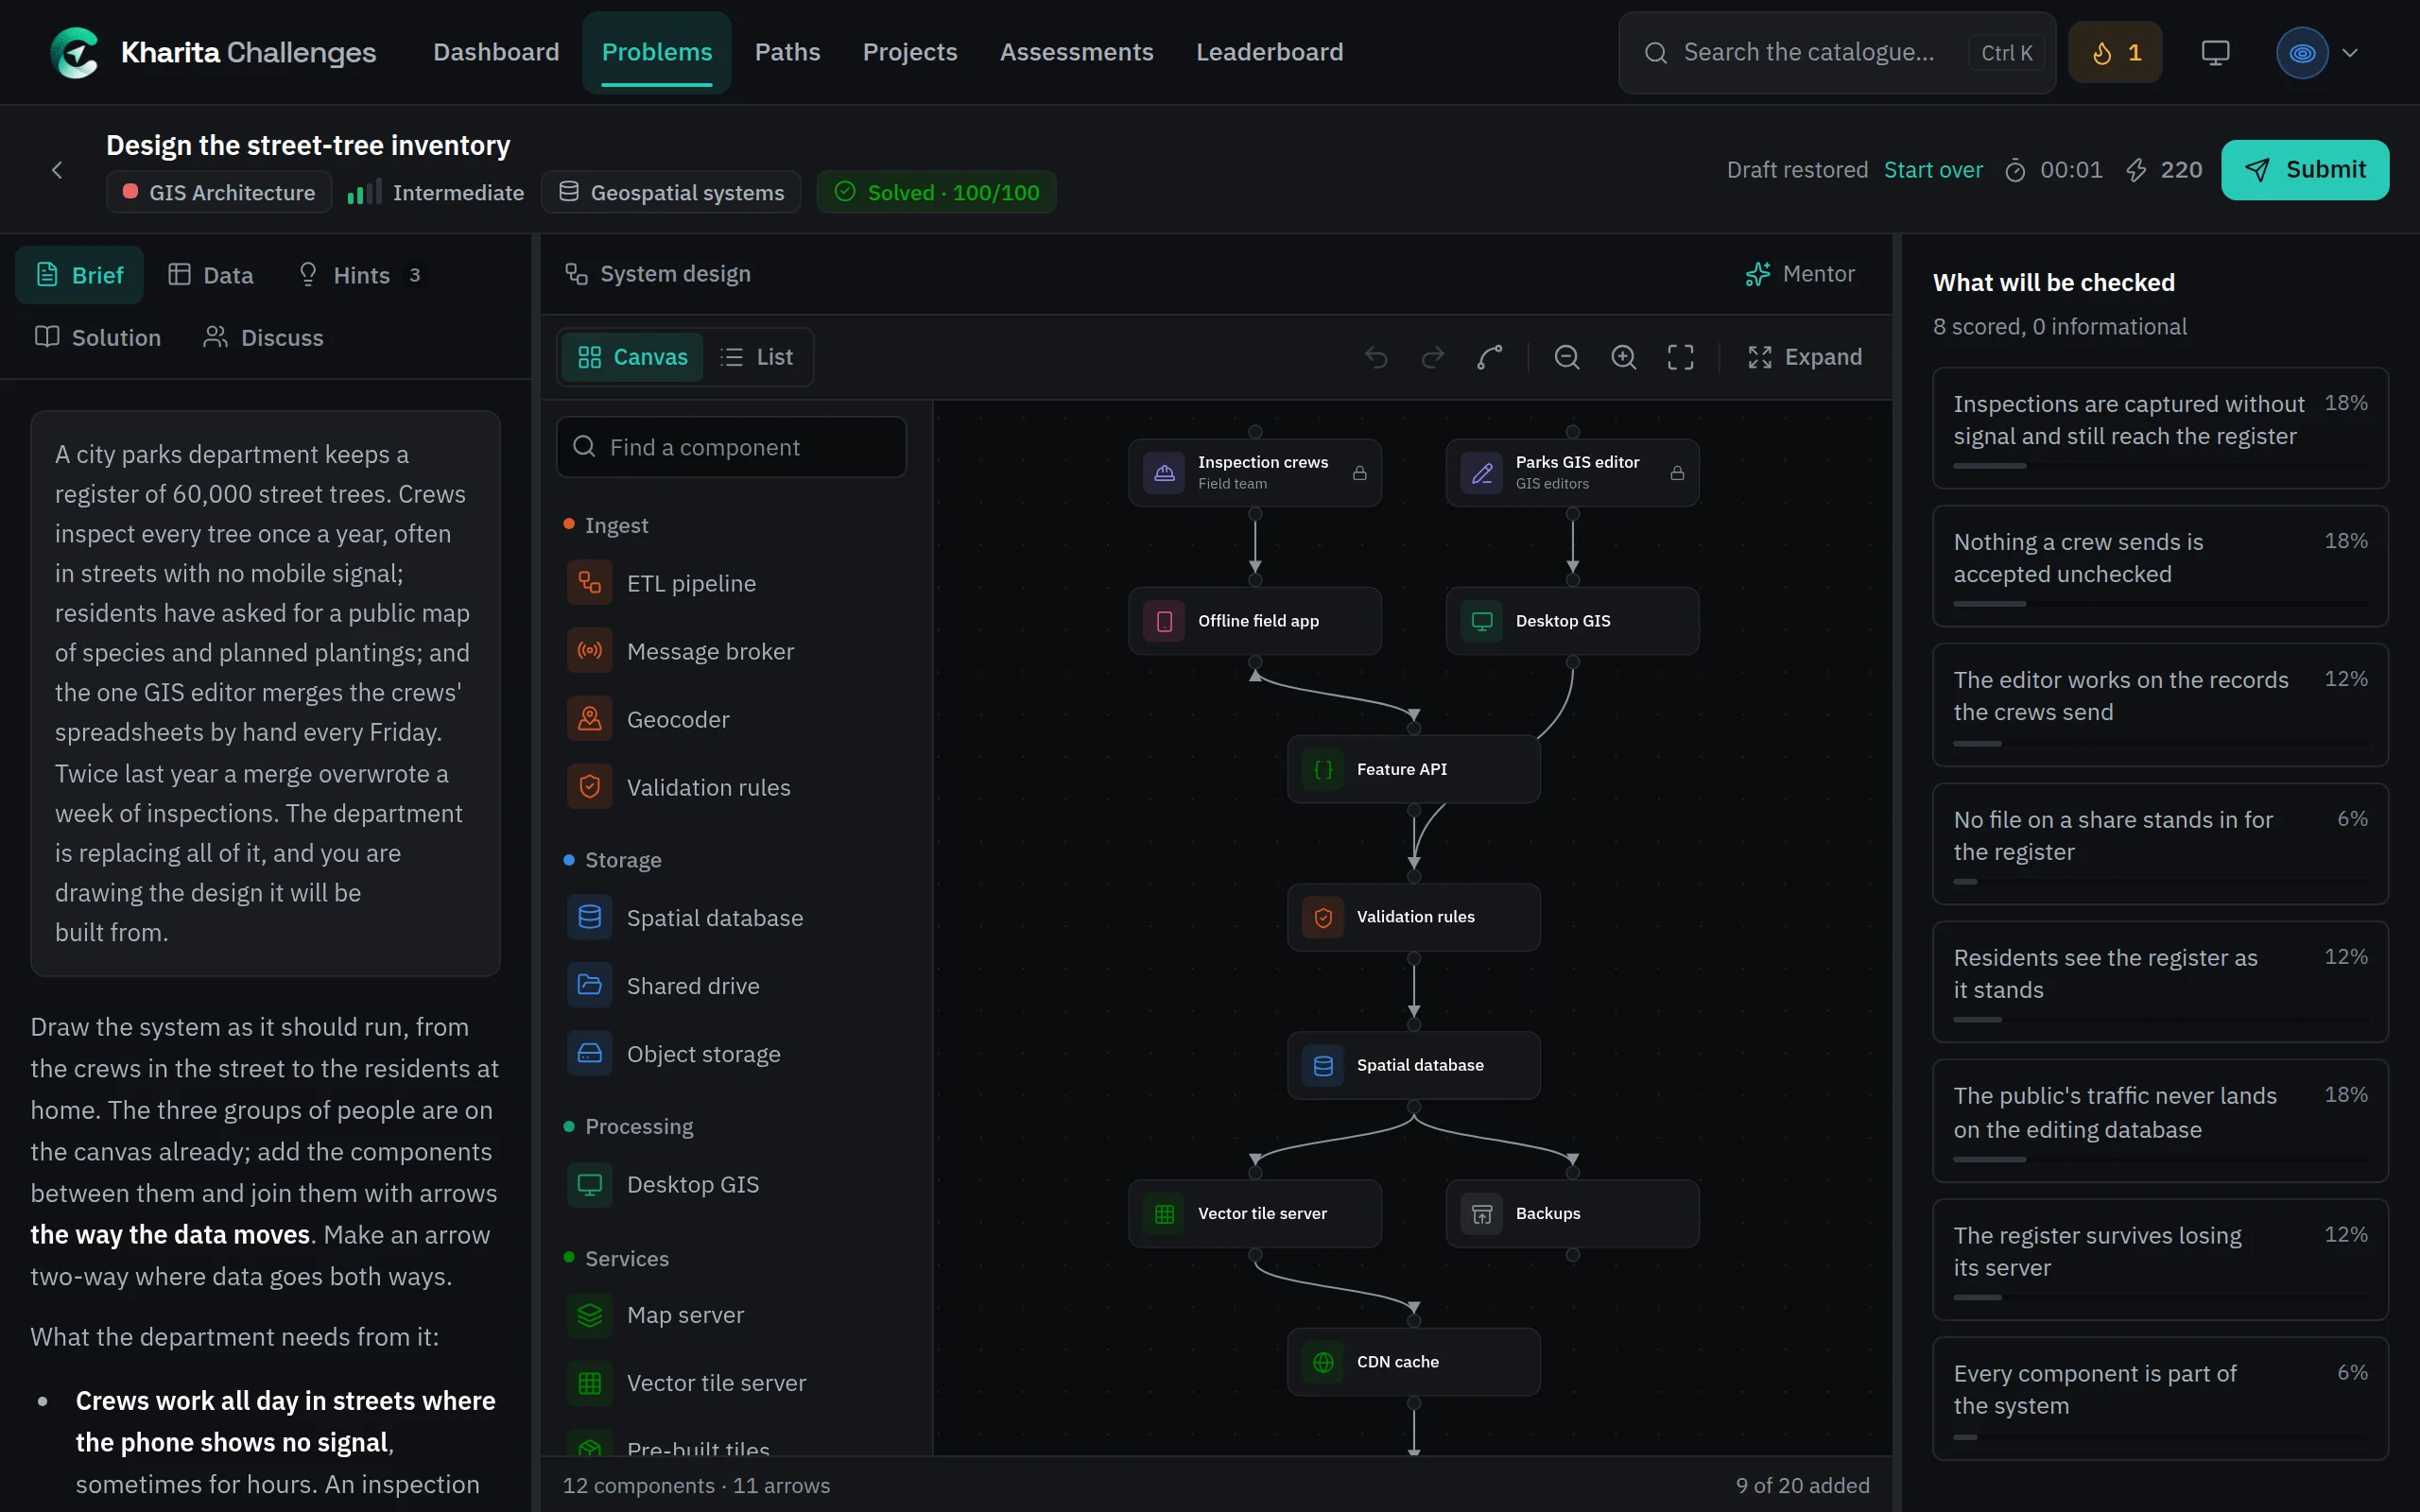
A system drawn top to bottom, the way its data moves. Step 4: Right-click a part, an arrow or the empty canvas for what can be done there — rename it, add a note, Draw an arrow from here, Add another like it, remove it; label an arrow, make it two-way, turn it round; add a part where you clicked. Shift+F10 opens the same menu from the keyboard.
Step 5: Select a part or an arrow to edit it in the panel on the right.
Step 6: Submit. The panel on the right shows each requirement, and the route through your own diagram that answered it.
A deployment
A deployment's parts are the products an enterprise GIS runs on — the ArcGIS apps people use, ArcGIS Online, Portal for ArcGIS, every ArcGIS Server role, the Data Stores, the Web Adaptor, ArcGIS Enterprise's pods on Kubernetes, ArcGIS Monitor, GeoServer, PostgreSQL and PostGIS, etcd — drawn as servers, and an arrow follows a request to the part that answers it. Each part's description says what it stands on, and a part a release has retired or is removing says so in its name.
- Runs in: the availability zone a part stands in, set in its panel or its menu. The zone's letter shows on the part.
- Add another like it copies a part beside it with its arrows — redundancy, drawn. Say which zone the copy runs in.
- A Replication arrow, drawn dashed, is a copy kept in step, and carries no request. Draw one with Draw a replication from here, or turn an arrow into one under Kind.
- A part marked zone-redundant — a CDN, a managed load balancer, cloud object storage, a zone-redundant file share, a cloud's managed relational store, ArcGIS Online — fails over by itself, even when a whole zone is lost. One marked redundant — a highly available file share in one room — fails over by itself when a machine stops, and is lost with its zone, so say which zone it runs in.
- A backup, a monitor, an identity provider, a container registry or a disaster-recovery site is where a request starts or ends: no route passes through one.
A data model
A data model is drawn as UML classes. The classes the brief names start not decided yet, with a dashed outline; each box shows what the class is stored as above its name, and its attributes below.
Step 1: Stored as: choose a point, line, polygon or multipoint feature class, or a table, in the class's panel, its menu or the List.
Step 2: Attributes: tick the ones the class carries in its panel, or drag one from the list on the left onto the class. An attribute that belongs on no class can be left off.
Step 3: Hold an attribute to a domain where the brief has a fixed list of values or a span of numbers or dates. A domain is made for one type of attribute and holds only that type, and a range holds only a number or a date.
Step 4: Draw a relationship from the origin to the destination, then say How many of each end, read from the origin, and whether it is Composite: deleting the origin deletes what it relates to. A simple relationship keeps them, and drops only their link to it; a many-to-many is never composite. Where both ends repeat, a class of your own between them, related to each one to many, can stand in for the many-to-many.
Without a mouse
List shows the same diagram as two ruled lists — the parts, then the arrows — and makes the canvas's edits: add a part, name it, note why it is there, say where it runs or what it is stored as and which attributes it carries, draw an arrow from one part to another and say its kind, make it two-way, turn it round, take any of it away. On the canvas, Tab reaches each part and arrow, Enter or Space selects it, the arrow keys move a part, Shift+F10 opens its menu and Delete removes it.
How a diagram is graded
- What is joined to what, never where it sits. Positions, names and notes are kept with your answer and never scored.
- A part counts once an arrow joins it to the rest. One left loose does nothing in the system, and a requirement may say so. A data model's class counts as soon as it is on the canvas.
- Routes follow the arrows. A requirement may ask that data reaches a part, that every route between two parts passes through a third — the requests through what spreads them, a store reached only through a server — or that a part is not there at all. A two-way arrow counts both ways; a replication carries no route. Where the way an arrow points is not the question, such as a backup taken or pulled, either way counts. Where the brief says every machine of a kind does something — every server reads the shared configuration — each one needs its own route, and one wired right does not count for the rest; with none of them in your design, that row is shown and not scored. A part the brief put on the canvas is different: left loose, it scores the rows that name it nothing.
- On a deployment, what survives. A requirement may ask that the routes through what serves something — the maps through the servers that draw them — keep working after any one machine stops, or a whole zone, with a way round each part on them; a way round the servers themselves serves nothing and counts for nothing there. It may ask that a component runs on as many machines as its vendor supports, that copies stand in enough zones, that most of a quorum outlives a zone, or that a standby is kept in step — two copies count as one store only when a replication keeps them in step. Where a machine reads shared storage, it has to reach it by an arrow of its own, not by way of another server.
- A blank canvas scores nothing. What a design leaves out — nothing retired, nothing open to the public — counts once you have started drawing.
- On a data model, each decision. What each class is stored as, which class an attribute sits on (or must not), the domain that holds it, and how two classes relate, read from the origin.
- A failed row shows your own route — the path the grader found, your arrows running it only the other way round, or nothing on your canvas at one end of it — and what it looked for appears once the row passes.
- Once you pass, the Solution tab shows the reference diagram beside the reasoning: as a list, with each part's note on why it is there, and on the canvas.
Tidy, Expand and Undo
- Tidy
- Lays the diagram out top to bottom, each part a row below what feeds it and each input beside the step that uses it; a copy kept in step sits beside what it copies, and an arrow that closes a loop points back up it.
- Expand
- Gives the canvas the whole window. Back to the page or Esc returns.
- Undo and redo
- Take back any edit, from the toolbar or with Ctrl Z (⌘ Z on a Mac).
- Fit
- Brings the whole diagram into view.
Related
Still stuck? Write to Support